
This explainer was written to accompany my analysis of MEP voting data on digital rights. It goes over the data sources and the decisions made in analysing and visualising the data. It is more a technical document than a blog post, so be aware.
The analysis this explainer accompanies can be found here. A link to download the full data can be found at the end of this explainer. For questions, leave a comment or send me an email.
Data collection
The data comes straight from the European Parliament website. MEP data was downloaded as XML from the overview of sitting MEPs: European Parliament website.
The voting data was collected from the plenary sittings page, under the tab voting results: European Parliament website. The calendar in the bottom right allows browsing through the dates of sittings, each opening into the minutes (example).
It relies on rollcall votes, which have been mandatory for final votes since 2015. Additional rollcall votes can be cast on amendments, but I have decided to focus on the final vote due to time limitations. The rollcall votes are presented in PDF format, listing the names of each MEP who voted on the issue, categorised per vote (positive, negative, abstain) and Parliamentary party (example).
MEPs can change their vote after the fact, but this is a purely administrative process. It does not change the outcome of each vote, so I chose to ignore these.
I'm aware Parltrack makes this data available in a structured, machine-readable format, but due to the recent timing of three of the five issues addressed they were not yet available. For this project, it was not feasible to rely on a better data source.
The following voting tallies were used:
- 2012-07-04 ACTA
- Results, p.4; vote 10
- Rollcall, p.19; vote 8
- 2014-03-12 GDPR
- Results, p.2; vote 5
- Rollcall, p.14; vote 5
- 2019-03-26 Article 13 (now Article 17)
- Results, p.7; vote 11
- Rollcall, p.48; votes 21 and 22
- 2019-04-16 Biometric database
- Results, p.12; votes 31 and 32
- Rollcall, p.60; votes 29 and 30
- 2019-04-17 Terror blockers
- Results, p.16; vote 30
- Rollcall, p.87; votes 42-59
Data preparation
The data was extracted from PDFs to text files and prepared in Pentaho Data Integration. Here, I combined the votes and joined them on the name of each MEP.
The transformed data was loaded into a MySQL database. Here I created a view joining the MEP names with their respective votes. Because the MEP names were only available in the format <firstname LASTNAME>, I created the following view:
CREATE VIEW `mep-votes-name` AS
SELECT
    mep.id, mep.fullName, votes.name, mep.country, mep.politicalGroup, mep.nationalPoliticalGroup,votes.acta, votes.gdpr, votes.article13, votes.biometrics30, votes.biometrics31, votes.terrorism
FROM mep
LEFT OUTER JOIN votes
    ON LOWER(mep.fullName) LIKE LOWER(CONCAT("%", votes.name));
I went through this data in Excel to mark any duplicates, such as Jan Keller and Ska Keller both matching Keller from the previous parliamentary term (Ska Keller served in that term, so that voting data was mapped on her).
Other names were using different letters to say the same: Preuß and Preuss. Again others (such as the Kellers from above) were [firstname][lastname] in the MEP data and [lastname][firstname] in the voting data. These were reversed in the voting data to match them.
Two MEPs did vote in the current term, but did not match with the MEP data: McAvan and Padar. I found no good reference for these names, so I discarded them.
Accuracy check
The final tallies on the four votes analysed in the current parliamentary term were used to check the data accuracy. There are a few votes unaccounted for in the biometrics dataset: 9 for votes in the first, 11 for and 3 against in the second. Upon finding no direct reason for this, these have been taken for granted. The image below shows the coverage on each vote.
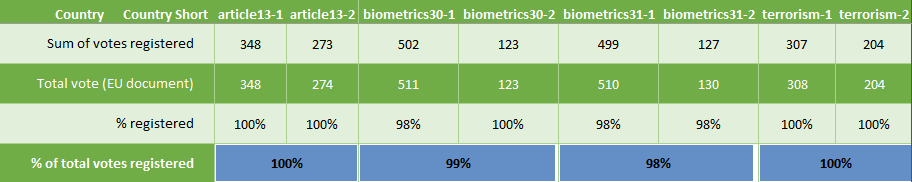
As for the two votes of the previous parliamentary term, the coverage lies at 42% in these calculations, but is higher in reality (66 MEPs included voted on on of these issues but were not present at another). This is to be expected, as only re-elected MEPs get accounted for on these issues. And only if they voted.

A later rerun of the data preparation included a separation between abstaining and not voting, potentially giving a higher coverage. A quick litmus test showed that 32% of abstained votes on the GDPR were captured, slightly lowering the overall capture rate (to 41% in case of the GDPR).
Data Visualisation
I want to address three points when it comes to the data visualisation: combining the two biometrics votes and normative classification.
Normative classification
I chose to present the final data in a normative fashion, as the goal of the post is to create more awareness around digital rights. Each vote was scored based on the value that a vote against each issue is a vote for digital rights, except for the GDPR, where its acceptance was the desired outcome.
Two scoring systems were considered: only giving points for favourable votes and counting both positive and negative votes. After trying both, the second system gave a better balance between positive and negative votes, as depicted below.
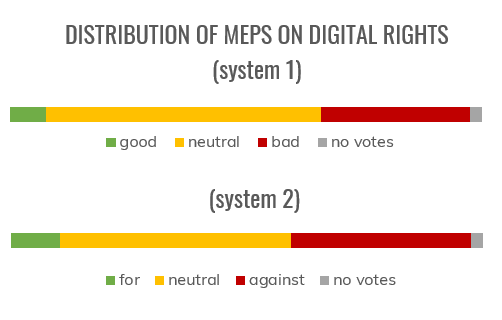
System 1 classifies a MEP as for when they have 3 points or more for digital rights and as against when they scored 1 or below. System 2, as shown below and in the post itself, requires a balance of >2 for for and <-1 for against. System 1 gave more strange edge cases, where 3 votes for and 2 against digital rights gave a for classification.
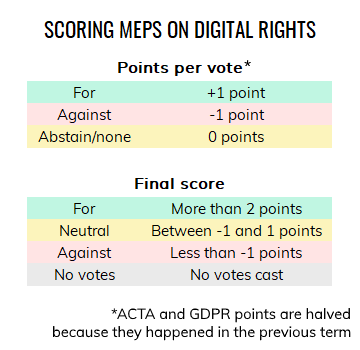
Ultimately, the choice was made to halve the value of the ACTA and GDPR votes due to their age. By reducing these values, both positive and negative votes in the current parliamentary term are more impactful. This was done with the purpose of showing both historical data, but also accounting for the change in public debate. A lot happened in the 7 years since the ACTA vote took place.
Combining the two biometrics votes
The large biometrics database was made possible by a combination of two votes. Each considered a distinct domain to be added to the database. To tie it in into the normative scoring, I gave the benefit of the doubt to the voters.
Only two votes in favour of the database were classified as a vote against digital rights, whereas a single vote against the database and another for was classified as supporting digital rights.
Full data and questions
This is the first data-driven blog post I did. This explainer is my attempt at providing documentation in the process of gathering and analysis. If certain points lead to frequent questions I will update this explainer accordingly.
The full, prepared data used for scoring and visualisation can be found here as UTF-8 encoded CSV. Votes are recorded as 0=abstain, 1=positive vote, 2=negative vote, 4=absent from vote (I had trouble counting there...). For questions or more of the items I used in preparing and visualising data, leave a comment or send me an email.